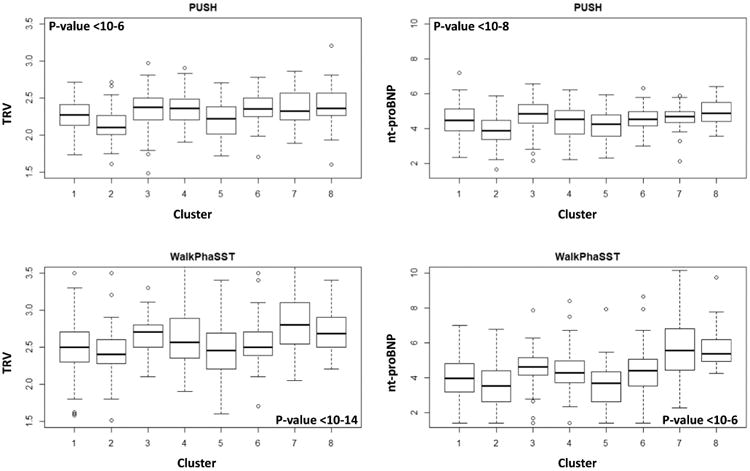
Figure 5. Distributions of TRV and nt-proBNP in the clusters predicted in PUSH and Walk-PHaSST.

The distributions of TRV and nt-proBNP among clusters were significantly different (p-value from ANOVA, age-adjusted, shown in each panel).

The distributions of TRV and nt-proBNP among clusters were significantly different (p-value from ANOVA, age-adjusted, shown in each panel).