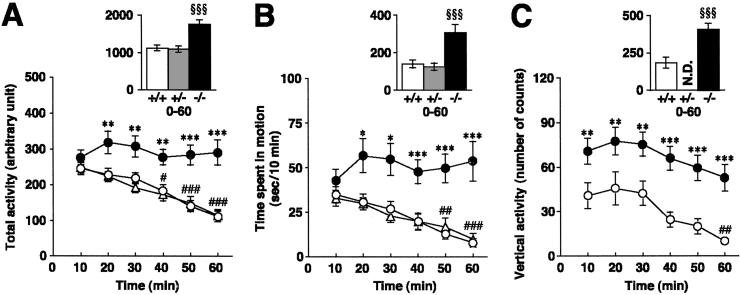
Figure 2.
Open-field measures. Total activity (A) and time spent in motion (B) are shown for PACAP+/+ (white circles), PACAP+/− (white triangles), and PACAP−/− (black circles) mice (n = 20 for all groups). (C) Vertical activity is shown for PACAP+/+ and PACAP−/− mice (n = 14 for both groups). *, P < 0.05; **, P < 0.01; ***, P < 0.001 vs. PACAP+/+ mice. #, P < 0.05; ##, P < 0.01; ###, P < 0.001 vs. first 10 min, ANOVA, followed by post hoc Fisher Protected Least Significant Difference (PLSD) test; §§§, P < 0.001 vs. PACAP+/+ mice, Kruskal–Wallis ANOVA, followed by Mann–Whitney U test. N.D., not determined.

