Figure 3.
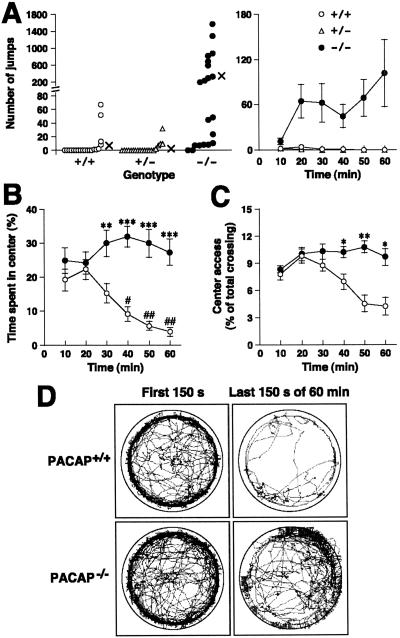
Jumping behavior, increased central entry, and locomotor pattern of PACAP−/− mice in the open field. (A) Number of jumps in the open field. The actual number of jumps observed in individual mice and mean values (×) for 60 min (Left), and means ± SE at 10-min intervals (Right) are indicated. (n = 20 for all groups.) (B and C) Time spent in the center (B) and center access (C) (percentage of crossings into the center zone out of the total number of crossings) are shown for PACAP+/+ (white circles) and PACAP−/− (black circles) mice (n = 20 for all groups). *, P < 0.05; **, P < 0.01; ***, P < 0.001 vs. PACAP+/+ mice. #, P < 0.05 and ##, P < 0.01 vs. first 10 min, ANOVA, followed by post hoc Fisher PLSD test. (D) Examples of locomotor patterns of PACAP+/+ (Upper) and PACAP−/− (Lower) mice during the first 150 s (Left) and last 150 s (Right) of a 60-min recording. Tracks of representative 10 mice in each group are shown. The tracks outward across the circular boundary represent the jumping behavior (see supporting information).

