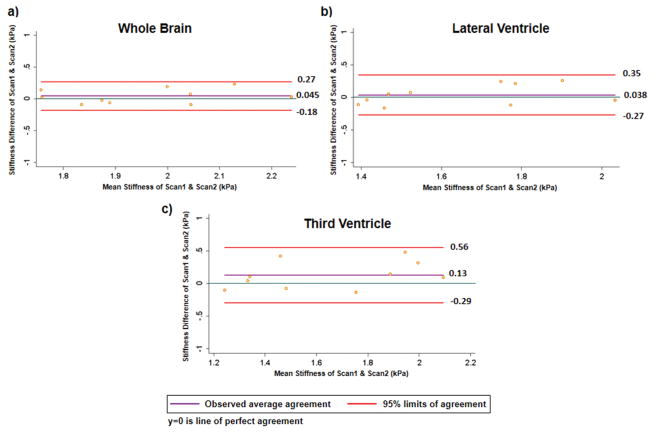
Figure 4.
Bland-Altman plots for a) whole brain with observed average agreement of 0.045(95% CI:−0.18,0.27); b) periventricular region of lateral ventricle with observed average agreement of 0.038 (95% CI: −0.27, 0.35); c) periventricular region of third ventricle with observed average agreement of 0.13(95% CI: −0.29, 0.56).

