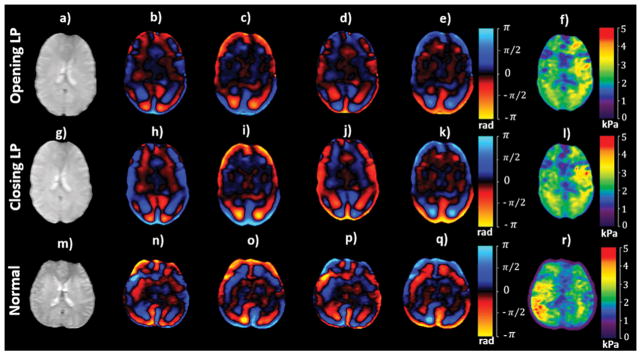
Figure 5.
An axial magnitude image (a; g) covering the lateral ventricles in a pseudotumor cerebri patient, along with snap shots of wave images (b–e; h–k) with motion encoding in the anterior-posterior direction and (f; l) the corresponding shear stiffness map before and after LP, respectively. An axial magnitude image (m) in a normal volunteer, along with snap shots of wave images (n–q) with the corresponding shear stiffness map (r).

