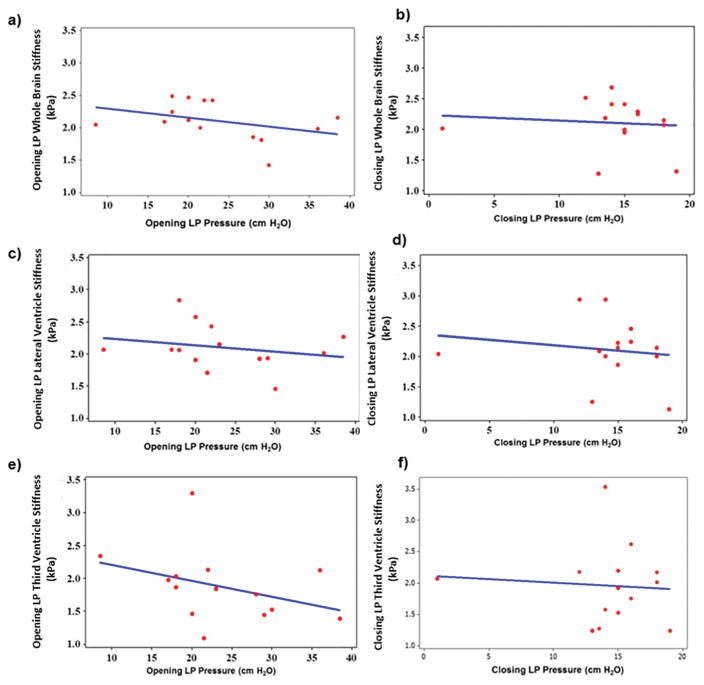
Figure 8.
Spearman rho correlation plot between MRE-derived opening LP whole brain shear stiffness and LP opening pressure (ρ=−0.42, p=0.13) (a); closing LP whole brain shear stiffness and LP closing pressure (ρ=−0.19, p=0.52) (b); opening LP lateral ventricle shear stiffness and LP opening pressure (ρ=−0.27, p=0.34) (c); closing LP lateral ventricle shear stiffness and LP closing pressure (ρ=−0.16, p=0.59) (d); opening LP 3rd ventricle shear stiffness and LP opening pressure (ρ=−0.46, p=0.09) (e) and closing LP 3rd ventricle shear stiffness and LP closing pressure (ρ=−0.05, p=0.86) (f).

