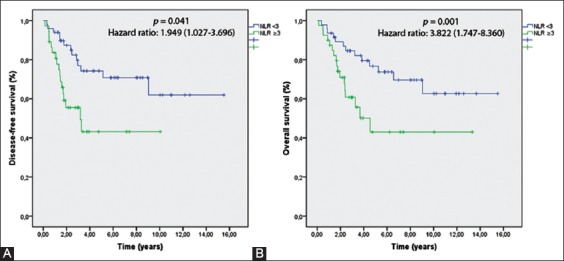
FIGURE 1.

(A) Disease-free survival (DFS) rates according to the neutrophil-to-lymphocyte ratio (NLR) classification. (B) Overall survival (OS) rates according to the NLR classification. NLR ≥3 was significantly associated with poor DFS (p = 0.041) and OS (p = 0.001).
