Figure 2.

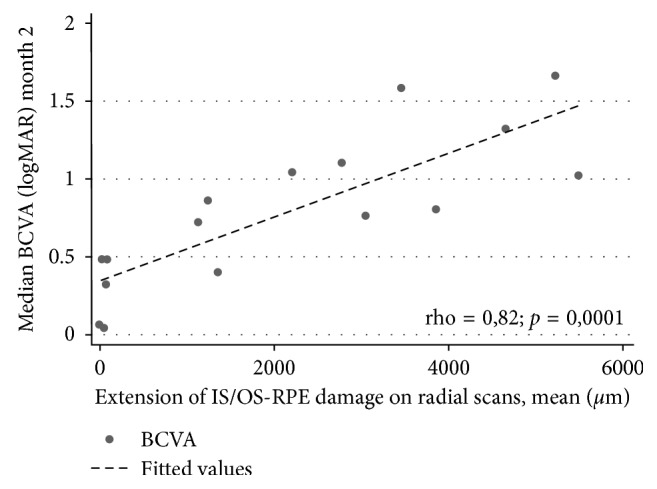
Scatter plot showing the correlation between the median BCVA at month 2 and the extension of the IS/OS junction, ELM, and RPE damage at 2 months (rho = 0, 82; p=0.0001).

Scatter plot showing the correlation between the median BCVA at month 2 and the extension of the IS/OS junction, ELM, and RPE damage at 2 months (rho = 0, 82; p=0.0001).