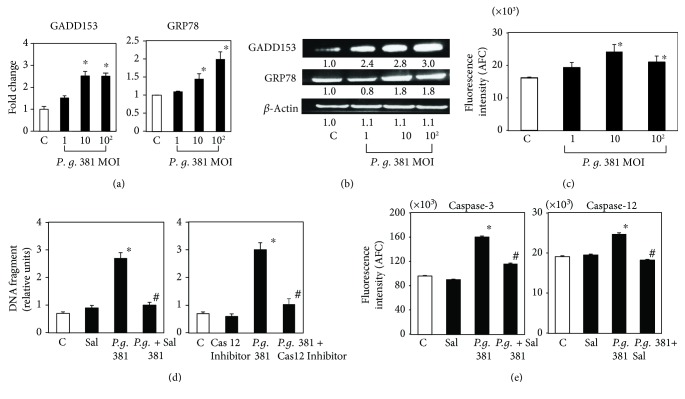
Figure 2.
P. gingivalis 381 induces UPR-like response in HUVEC. (a) HUVEC were treated with P. gingivalis 381 at an MOI of 1 : 1–1 : 102 for 8 h. Quantitative real-time PCR analysis was performed for GADD153 and GRP78 relative to β-actin expression. Data are expressed as the mean ± SEM of 3 different experiments. ∗p < 0.01 versus bacteria-free control cells. (b) HUVEC were treated with P. gingivalis 381 at an MOI of 1 : 1–1 : 102 for 21 h. Whole cell lysates were subjected to SDS-PAGE, followed by Western blot analysis using antibodies to GADD153 and GRP78. Levels of β-actin were also detected as an internal control. The density of each band was measured by densitometry, and the relative band densities were calculated by comparing the band densities with those of the control. (c) HUVEC were treated with P. gingivalis 381 at an MOI of 1 : 1–1 : 102 for 16 h. Cell extracts were then prepared, and caspase-12 activity was measured. Data are expressed as the mean ± SEM of 3 different experiments. ∗p < 0.01 versus bacteria-free control cells. (d) HUVEC were pretreated with a caspase-12 or ER stress inhibitor for 1 h and then treated with P. gingivalis 381 at an MOI of 1 : 102 for 24 h. The ratio of apoptotic cells to total cells was determined using the Cell Death Detection ELISAPLUS Kit. Data are expressed as the mean ± SEM of 3 different experiments. ∗p < 0.01 versus bacteria-free control cells. #p < 0.01 versus bacteria-treated control cells. (e) HUVEC were pretreated with an ER stress inhibitor for 1 h and then treated with P. gingivalis 381 at an MOI of 1 : 102 for 16 h. Cell extracts were then prepared, and caspase activity was measured. Data are expressed as the mean ± SEM of 3 different experiments. ∗p < 0.01 versus bacteria-free control cells. #p < 0.01 versus bacteria-treated control cells.

