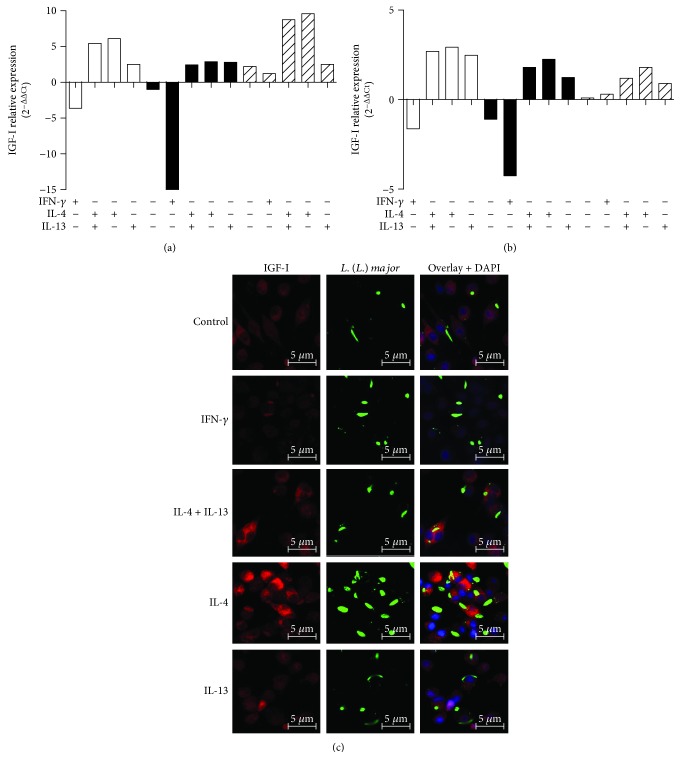
Figure 2.
IGF-I expression in response to cytokine treatment. (a and b) Quantification of Igf-I mRNA in L. major promastigote- (black bars) or amastigote-infected (striped bars) or noninfected (white bars) RAW 264.7 cells (a) and BALB/c peritoneal macrophages (b) is shown. Cells were stimulated with IFN-γ (200 U/mL), IL-4 (2 ng/mL), and IL-13 (5 ng/mL) for 48 hours. One representative experiment from three independent assays is shown. (c) Detection of IGF-I expression using confocal microscopy of cells labeled with a 1 : 75 dilution of an anti-IGF-I antibody (using an Alexa Fluor 546-conjugated secondary antibody; red) and a 1 : 200 dilution of an anti-Leishmania antibody (using an Alexa Fluor 488-conjugated secondary antibody; green) in L. major promastigote-infected macrophages is shown. Nuclei were stained with DAPI (blue). Images were captured using a confocal Leica LSM510 microscope with a 63x oil immersion objective. The expressions are relative to the expression in untreated cells (the baseline).

