Figure 3.
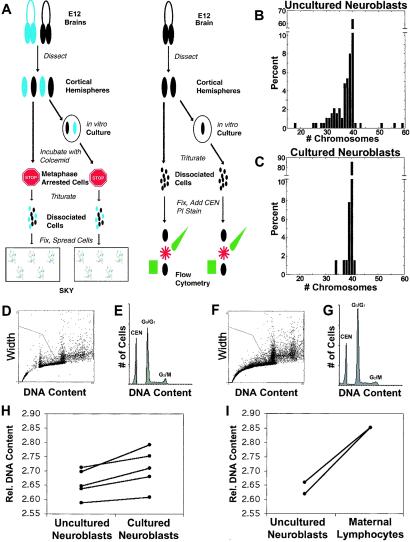
The rate of aneuploidy is attenuated in vitro. (A) Flowchart summarizing the protocol for comparison of uncultured (acutely isolated) and cultured neuroblasts by SKY and flow cytometry. (B and C) Chromosome count histograms from SKY analysis of uncultured (B) and cultured with FGF-2 (C) neuroblasts reveal a decrease in the proportion of aneuploid cells in cultured preparations. The fraction of cells missing more than one chromosome was lower in cultured than in uncultured neuroblasts. In both conditions, the majority of prometaphases/metaphases examined had 40 chromosomes; among aneuploid cells, the majority had lost chromosomes. The mean number of chromosomes is 38.69 for uncultured neuroblasts and 39.77 for cultured neuroblasts, a difference of 2.78%. (D–G) Flow cytometric analysis of propidium iodide-stained neuroblasts from uncultured (D and E) and cultured (F and G) cortical hemispheres. DNA content histograms for uncultured (E) and cultured (G) neuroblasts are qualitatively similar. For quantitation of DNA content, Gaussians were fit to the G0/G1 and chick erythrocyte nuclei (CEN) peaks. Relative DNA content was expressed as the ratio of the mean of the G0/G1 peak to the mean of the CEN peak. (H) Cultured neuroblasts have 2% more genomic DNA on average than uncultured neuroblasts (P < 0.01, paired t test). Each solid line connects uncultured to cultured samples from the same animal. Error bars are omitted for visual clarity but were never greater than 0.55%. (I) Maternal lymphocytes have more genomic DNA than uncultured neuroblasts.

