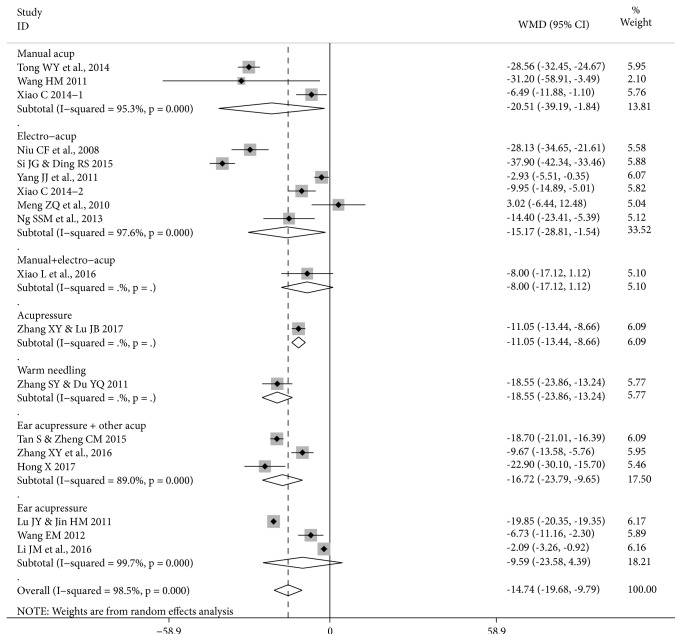
Figure 4.
Forest plot of acupuncture therapy versus postoperative care for time to first flatus (17 RCTs, 18 groups). Note: this forest plot focuses on the effect sizes for each study. Since Xiao C 2014 is a three-group study with two test groups of n=30 and one control group n=30, in the main meta-analysis (Table 4) the number of participants was halved n=15 in each comparison. In this figure, the control group remains n=30, so this has a small effect on the result for the total pool. The pooled result in Table 4 is the more accurate estimate of the pooled effect size, while the effects for Xiao C 2014-1 and Xiao C 2014-2 are accurate in this figure.

