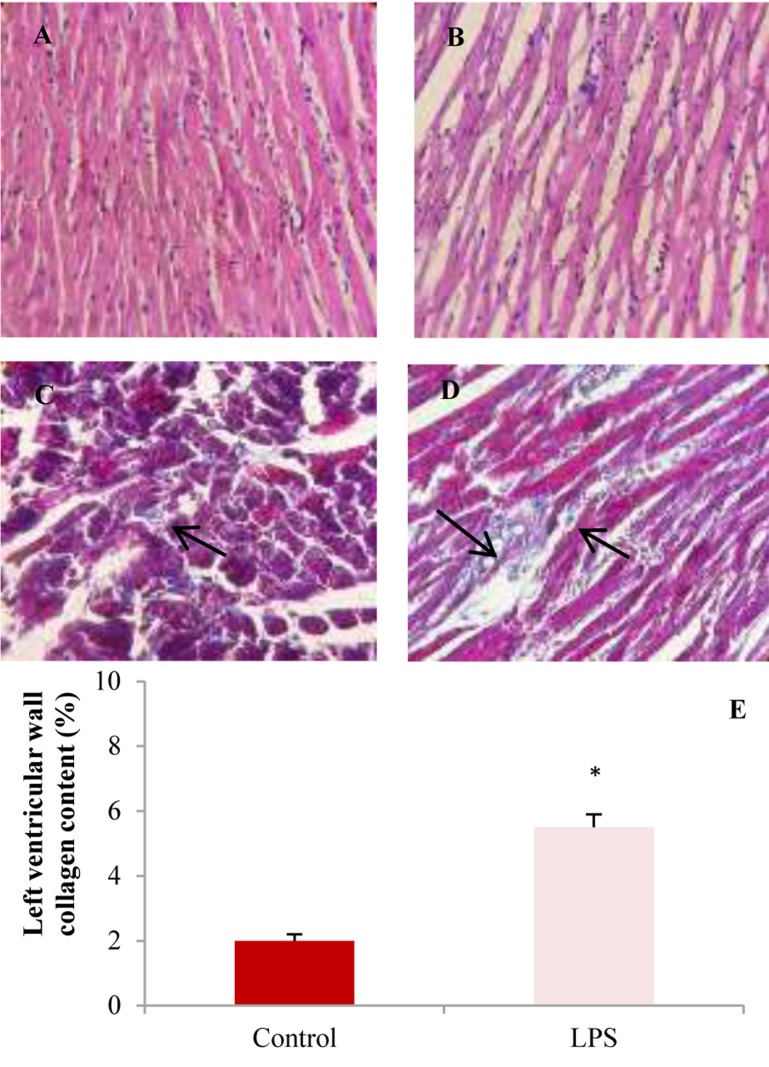
Figure 4.
The light micrograph of left ventricles in control and lipopolysaccharide (LPS)-treated groups. A: Control group with normal architecture [×20, hematoxylin and eosin (H&E)]. B: Recurrent LPS treatment [(10 mg/kg/week for 4 weeks (×20, H&E)] showing infiltration of inflammatory cells, edema and disarrangement of fibers. Masson trichrome staining of left ventricular muscles of control (C) and LPS (D) groups show more collagen deposition (blue color, black arrows) in LPS-treated group. Blue color indicates collagen fibers. E: Left ventricular wall fibrosis showed higher collagen content (%) in LPS group compared to control (* P < 0.050 compared to control).

