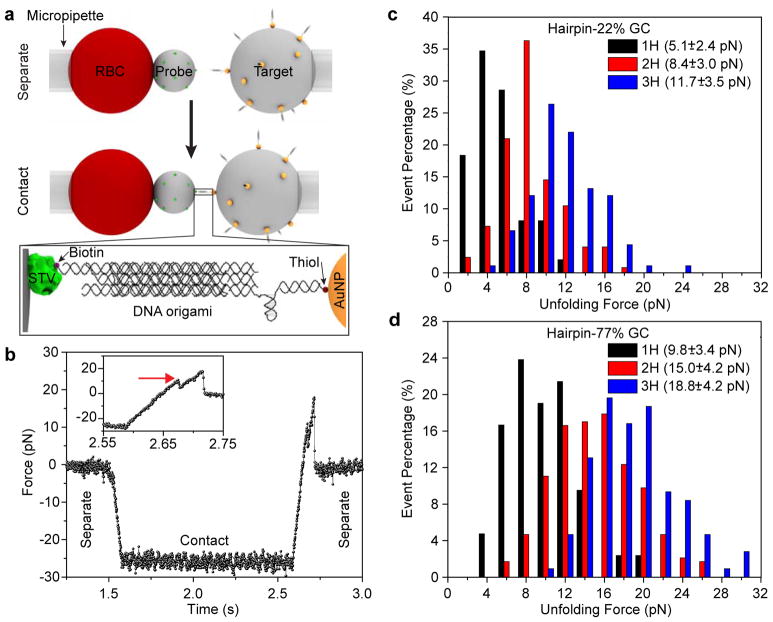
Figure 2.
DOTP calibration with BFP single-molecule force spectroscopy. (a) Schematic showing BFP setup. A micropipette-aspirated red blood cell (RBC) is affixed to a streptavidin (STV, green)-coated probe bead. A DOTP-coated target bead, which itself is aspirated by another micropipette, is brought into contact with the STV-coated bead. The ligand-presenting domains each present one biotin (purple sphere), resulting in biotin-STV binding between the two beads. The target bead is then retracted to apply tension to the DOTP. Zoom-in shows the assembled DOTP between the two beads. (b) Representative trace of a single molecule unfolding event showing unfolding of a 1H-77% GC DOTP. Zoom-in of the trace (inset) shows the unfolding event. The red arrow indicates the opening of the hairpin at ~10 pN. (c) Histogram of unfolding events for 1H-22% GC (black, n = 50), 2H-22% GC (red, n = 100) and 3H-22% GC (blue, n = 90) DOTPs. (d) Histogram of unfolding events for 1H-77% GC (black, n = 42), 2H-77% GC (red, n = 230) and 3H-77% GC (blue, n = 98). The legends in (c) and (d) show the corresponding Funfold with standard deviation for each probe.

