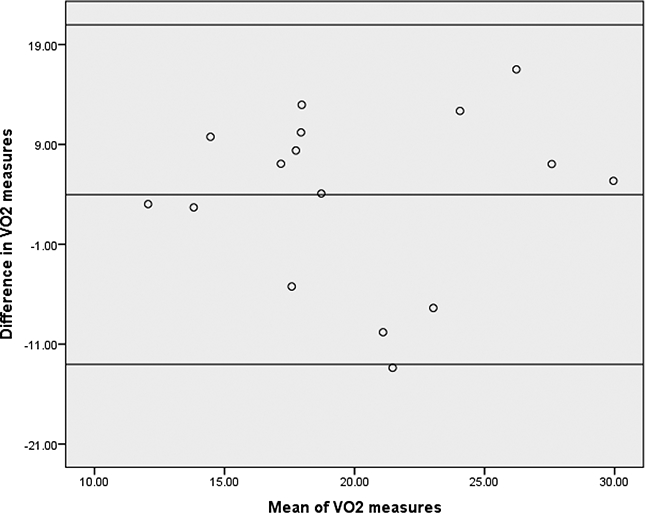
Figure 2. Bland-Altman plot BB group VO2maxHR & VO2maxRPE.

Note: Mean difference = 3.98; standard deviation= 8.67;
95% confidence limits: upper = 20.97; lower = −13.02
Regression coefficient B= 0.045, p = 0.868.

Note: Mean difference = 3.98; standard deviation= 8.67;
95% confidence limits: upper = 20.97; lower = −13.02
Regression coefficient B= 0.045, p = 0.868.