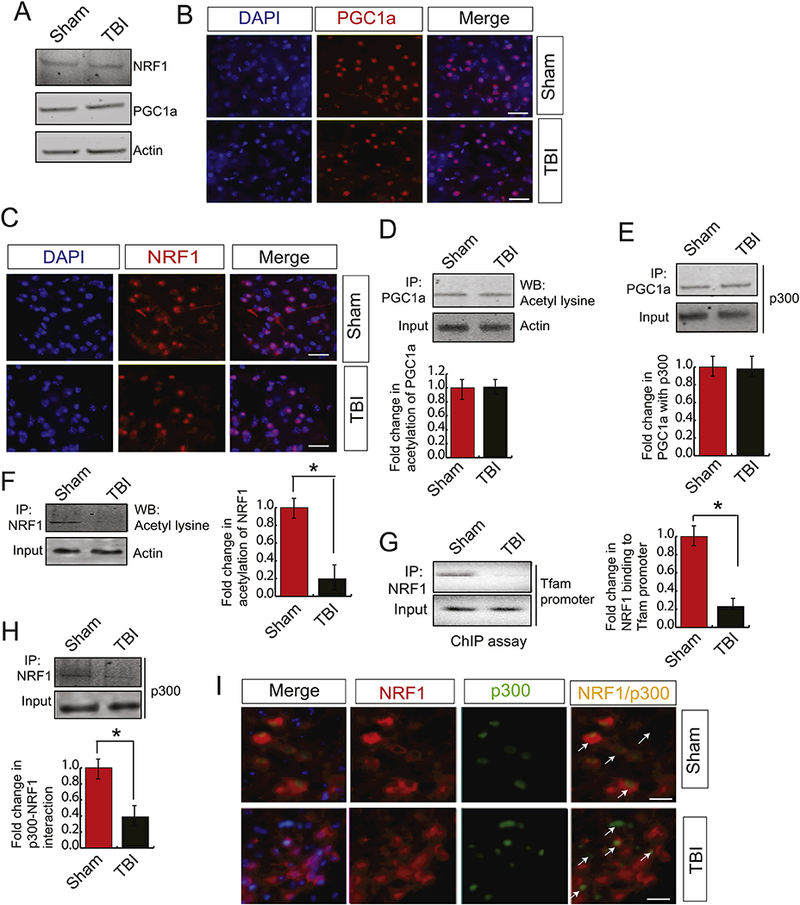
Figure 2: TBI does not affect the expression level of PGC1α and NRF1; however, decreases acetylation level of NRF1.

(A) Western blot analysis of NRF1 and PGClα in both sham and TBI samples and it was shown that the expression level of NRF1 remains the same after TBI. (B-C) Confocal microscopic analysis of PGClα (B) and NRF1 (C) in both sham and TBI samples and it shows that there is no change in the nuclear expression level of NRF1 and PGCla following TBI. Scale bar 10μΜ. (D) Immunoprecipitation assay detected acetylation of PGClα in both sham and TBI samples with PGClα antibody followed by western blotting using the acetyl- lysine antibody as described in the methods. The band intensity of acetylated PGClα was monitored by Image J and it shows that there is no change in acetylation level of PGClα. (n=3–5; one-way ANOVA, p<0.005) (E) Immunoprecipitation assay detected the interaction between PGClα and p300 in both sham and TBI samples by PGClα antibody followed by western blotting by p300 antibody as described in the methods. Image J monitored the band intensity of the interaction between PGClα and p300. The data shows that there is no change in acetylation level of PGClα (n=3–5; one-way ANOVA, p<0.005) (F) Acetylation of NRFl in both sham and TBI samples were detected by immunoprecipitation assay by NRF1 antibody followed by western blotting with the acetyl-lysine antibody. The band intensity of acetylated NRF1 was monitored by Image J and it shows that the acetylation level of NRFl was decreased significantly after TBI (n=3–5; one-way ANOVA, *p<0.005) (G) ChIP assay to demonstrate NRF1 binding to TFAM promoter. The band intensity of acetylated PGClα was monitored by Image J and it shows that NRF1 binding to TFAM promoter was decreased significantly after TBI (n=3–5; one-way ANOVA, p<0.005) (H) Immunoprecipitation assay detected the interaction between NRF1 and p300 in both sham and TBI samples by NRF1 antibody followed by western blotting by p300 antibody as described in the methods. Image J monitored the band intensity of the interaction between NRF1 and p300. The data shows that the interaction between NRF1 and p300 was decreased significantly after TBI (n=3–5; one-way ANOVA, *p<0.005). (I) Confocal microscopic analysis of p300 and NRF1 in both sham and TBI samples. The arrowhead shows colocalization and interaction between NRF1 and p300 in sham and TBI samples. The results show that the interaction between NRF1 and p300 was decreased in TBI mice. Scale bar 10μΜ.
