
Figure 2. Nanocrystalline ordering of dsDNA and dsRNA by AMPs modulates TLR-mediated inflammation.
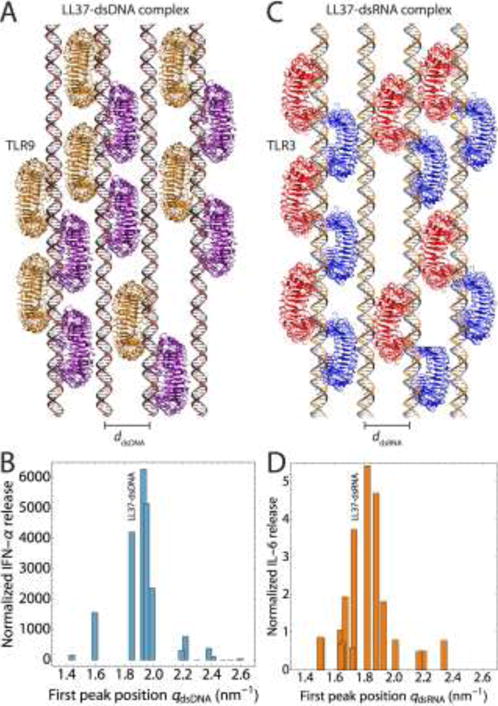
(A) Schematic of nanocrystalline LL37–dsDNA complexes binding to clustered arrays of TLR9 dimers in the endosomal membrane (ddsDNA = 3.40 nm). (B) IFN-ɑ production from human pDCs as a function of the inter-dsDNA spacing of AMP–dsDNA complexes. Complexes with inter-DNA spacings (ddsDNA) well-matched with the steric size of TLR9 leads to drastic amplification of inflammation, due to optimized multivalent intercalative binding of LL37–dsDNA to TLR9. The position of the LL37–dsDNA complex is labeled. Maximal IFN-ɑ production occurs for complexes with spacings in the range of 3.1–3.5 nm. Experimental data is adapted with permission from [9,94]. (C) Schematic of nanocrystalline LL37–dsRNA complexes binding to clustered arrays of TLR3 dimers in the endosomal membrane (ddsRNA = 3.63 nm). (D) IL-6 production from human keratinocytes as a function of the inter-dsRNA spacing of AMP–dsRNA complexes. Complexes with inter-RNA spacings (ddsRNA) well-matched with the steric size of TLR3 leads to strong amplification of inflammation, while those with poorly matched spacings do not. The position of the LL37–dsRNA complex is labeled. Maximal IL-6 production occurs for complexes with spacings in the range of 3.3–3.7 nm. Experimental data is adapted with permission from [10]. The optimal inter-ligand spacings for dsRNA is slightly larger than that for dsDNA, in agreement with the differences in steric size of TLR9 and TLR3, and the diameters of dsDNA and dsRNA. Schematics of TLR binding were generated in VMD (http://www.ks.uiuc.edu/Research/vmd/) using crystal structures from the PDB (3WPC for TLR9 and 3CIY for TLR3).