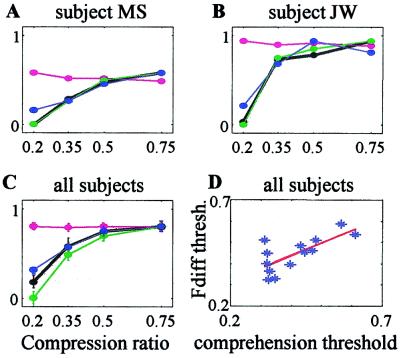
Figure 3.
Neuronal correlates for speech comprehension. A–C measures were averaged across PC1–3 (see Methods) and normalized to the maximal value of the comprehension curve; neuronal correlates with negative values were first “shifted” up by adding a constant so that their minimal value became 0. (A and B) Comprehension (black thick curve) and neuronal correlates (magenta, rms; green, Fdiff; blue, PL) for the S depicted in Fig. 2 (MS) and for another S (JW). (C) Average comprehension and neuronal correlates across all Ss (mean ± SEM, n = 13). (D) Scatter plot of thresholds for comprehension and Fdiff for all Ss. For each variable and each S, threshold was the (interpolated) compression ratio corresponding to 0.75 of the range spanned by that variable. The red line is a linear regression.

