Fig. 1.
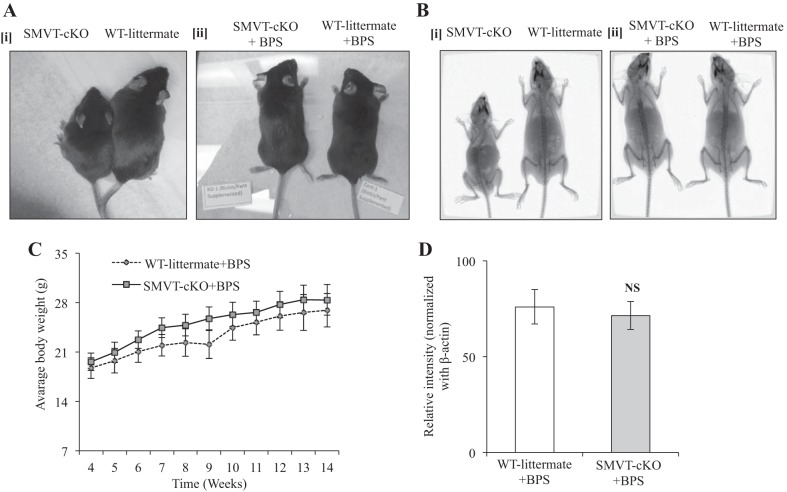
Effects of BPS to SMVT-cKO mice on growth rate, bone density, and biotin level. Ai: representative image of a SMVT-cKO mouse (left) and its sex-matched WT littermate (right) showing clear phenotypic differences in size and length that we have seen previously (12). Aii: representative image of BPS SMVT-cKO mouse (left) and its sex-matched BPS WT littermate (right) showing no difference in size and length. Bi: representative X-ray image of a SMVT-cKO mouse (left) and its sex-matched WT littermate (right) showing distinct difference in bone length. Bii: representative X-ray image of BPS SMVT-cKO mice (left) and its BPS WT littermate (right) showing no difference in bone size and length. C: growth chart showing no difference in weight gain of BPS SMVT-cKO mice compared with their BPS WT littermate. D: level of total biotinylated proteins in the liver (a measure of biotin status) of BPS SMVT-cKO mice and their BPS WT littermates. Data are means ± SE of at least three separate sets of mice. Abbreviations: BPS, biotin and pantothenic acid supplementation; cKO, conditional knockout of the mouse Slc5a6 gene; NS, not significant; SMVT, sodium-dependent multivitamin transporter; WT, wild type.

