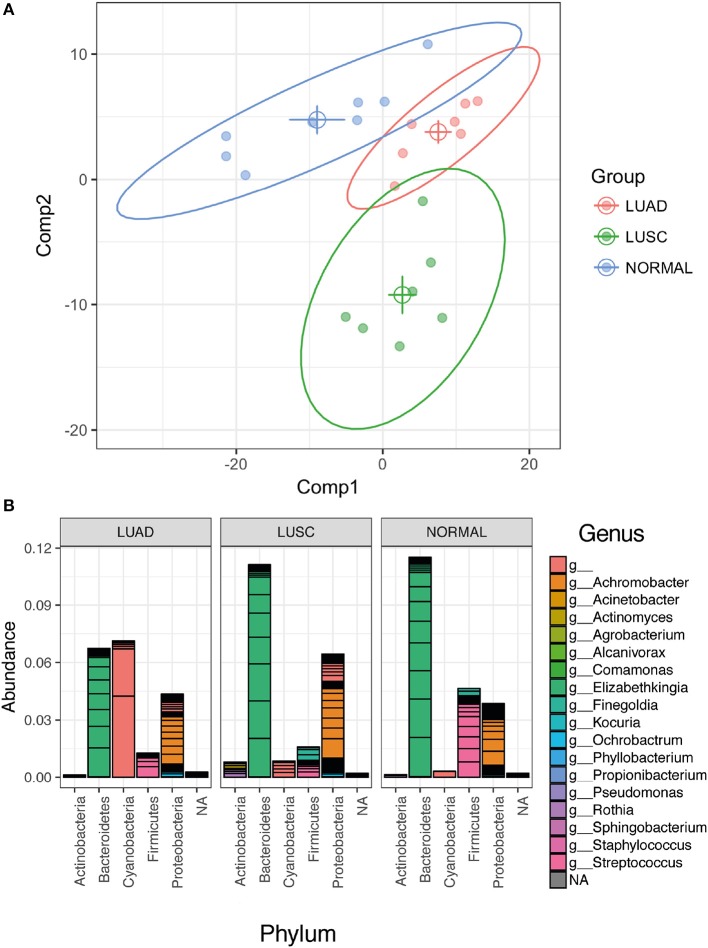
Figure 3.
Multivariate analysis using PLS-DA (Partial Least Squares Discriminant Analysis) method. (A) PLS-DA loading plot shows a good discrimination of the three groups of samples (normal, LUAD and LUSC). The solid circles represent individual samples. The centroid of the individual group was calculated and plotted as open circles. The 95% confidential ellipse of individual group was plotted as a solid line. (B) Stack OTUs bar plot of the relative abundance of bacterial 1048 phyla based only the OTUs that have VIP values > 1.5.

