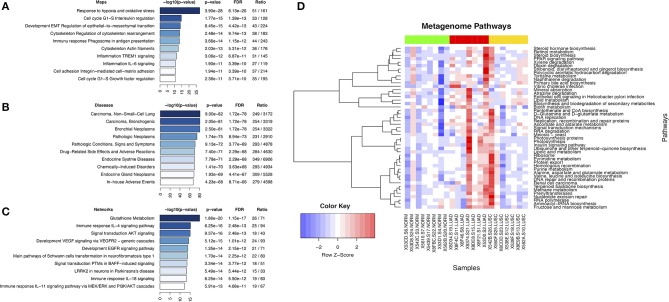
Figure 4.
Display of microcystin related pathways in lung cancer. (A) Top ten enriched pathways maps of microcystin genes in Cyanobacteria; (B) Enriched diseases for microcystin genes in Cyanobacteria; (C) Enriched process networks for microcystin genes in Cyanobacteria; (D) Metagenome pathways. The results of metagenome functional content prediction are shown. The metagenome content is annotated with KEGG pathways and comparison of the pathways in two groups are made (Wilcox rank sum test). The heatmap depicts only significant differences in pathway enrichment (p-value < 0.05). The heatmap colors show increased activity in pathways with red, and lower activity with blue. Normal samples (green color bar at the top) vs. LUAD samples (red color bar) vs. LUSC samples (yellow color bar) are shown.

