
FIGURE 9.
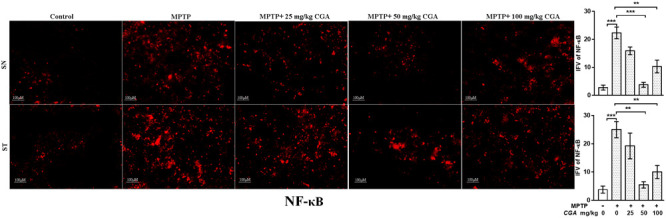
IHC of NF-κB in SN and striatum of mice. With 20 × magnifications after staining. NF-κB shows profound expression in the SN and striatum of MPTP-treated mice compared with the control group mice, while CGA treatment in MPTP mice shows moderate staining of NF-κB. Values are expressed as mean ± SEM (n = 3). ∗p < 0.05, ∗∗p < 0.01, and ∗∗∗p < 0.001. CGA, chlorogenic acid; MPTP, 1-methyl-4-phenyl-1,2,3,6-tetrahydropyridine; SN, substantia nigra; ST, striatum; NF-κB, Nuclear factor κB; SEM, standard error of mean; IFV, integrated fluorescent value.