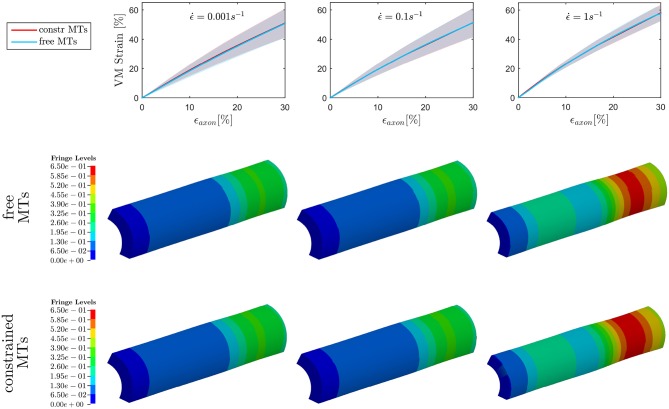
Figure 5.
Maximum von Mises (VM) strain in the axolemma (first row) computed when stretching the whole axon up to εaxon = 30% at strain rates , , and from left to right. Plots show the results obtained considering a realistic bundle kinematic (free MTs) and a simplified one (constrained MTs). Solid line and shaded areas represent respectively the mean value and the standard deviation computed over a family of 10 models. On the second and third row, fringe plots for one of the models show the strain distribution in the axolemma at εaxon = 30%, respectively in the free and constrained MTs configuration.

