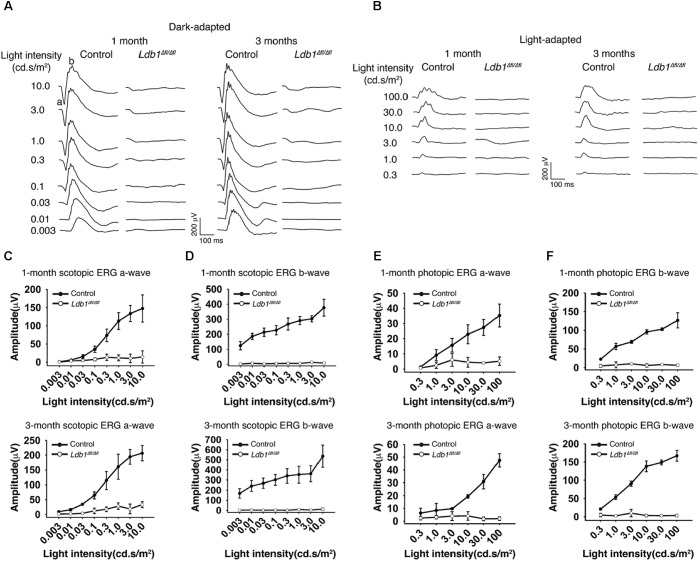
FIGURE 4.
Scotopic and photopic ERG recordings at different flash intensities from control and Ldb1 mutant mice. (A,B) Representative ERG waveforms from dark-adapted (A) or light-adapted (B) control and mutant animals aged 1 and 3 months. The flash light intensities used to elicit the responses were indicated to the left. (C,D) The average amplitudes of scotopic a-waves (C) and b-waves (D) from control and mutant mice aged 1 and 3 months are shown as a function of light intensities. (E,F) The average amplitudes of photopic ERG a-waves (E) and b-waves (F) from control and mutant mice aged 1 and 3 months are shown as a function of light intensities. Differences between control and mutant animals are statistically significant (p < 0.05) in scotopic and photopic examinations at almost all flash intensities except for a couple of weak ones. Values are shown as mean ± SD (n = 3) for all tests.

