FIGURE 6.
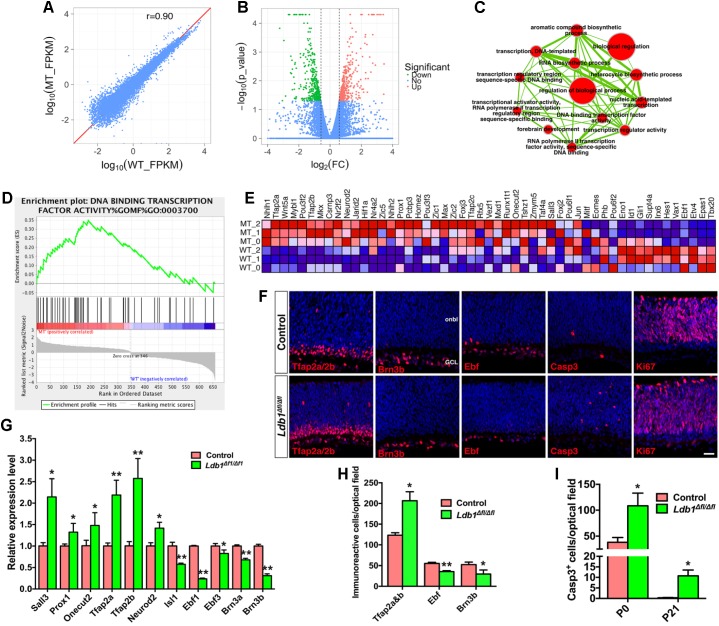
Abnormal cell generation and death in P0 Ldb1 mutant retinas. (A) RNA-seq analysis was carried out to reveal differentially expressed genes in control and Ldb1 mutant retinas at P0. The scatter plot shows global gene expression profiles in control and mutant retinas. Gene expression levels (FPKM) are depicted in the log10 scale. The diagonal line represents equal expression in the two groups. The Pearson correlation coefficient is 0.90. (B) Volcano plot (significance vs. fold change) displays significantly downregulated (green) and upregulated (red) genes (fold change ≥ 1.5 and p < 0.05) between control and mutant retinas. (C) The differentially expressed genes in the Ldb1 null retina were analyzed for GO term enrichment by gene set enrichment analysis (GSEA). The result was visualized on a network of gene-sets (nodes) connected by their similarity (edges). The node size represents the gene-set size and edge thickness represents the degree of overlap between two gene sets. (D) GSEA identified an enriched gene set associated with DNA-binding transcription factor activity. (E) GSEA output heatmap of expression levels for the enriched gene set associated with DNA-binding transcription factor activity. (F) Sections from P0 control and Ldb1Δfl/Δfl retinas were immunostained with the indicated antibodies and counterstained with nuclear DAPI. There is obvious increase of Tfap2a/2b- and activated caspase 3-immunoreactive cells but a decrease of Brn3b- and Ebf-immunoreacitve cells in the mutant retina. Ki67+ cells do not appear to change. (G) Relative RNA levels of the indicated genes determined by qRT-PCR analysis. Each histogram represents the mean ± SD for triplicate samples. ∗p < 0.05, ∗∗p < 0.001. (H) Quantitation of cells that are immunoreactive for the indicated markers in P0 control and Ldb1Δfl/Δfl retinas. Each histogram represents the mean ± SD for three retinas. ∗p < 0.05, ∗∗p < 0.001. (I) Quantitation of activated caspase 3+ apoptotic cells in control and Ldb1Δfl/Δfl retinas at the indicated stages. Each histogram represents the mean ± SD for three retinas. ∗p < 0.05. Abbreviations: GCL, ganglion cell layer; onbl, outer neuroblastic layer. Scale bar: (F) 20 μm.

