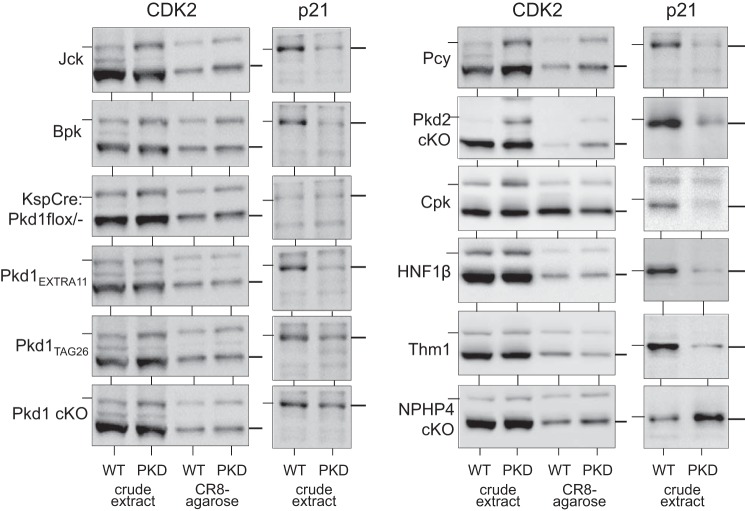
Fig. 7.
Expression of CDK2 and p21cip1 in the kidneys of a variety of mouse PKD models. Extracts were prepared from kidneys of mouse PKD and corresponding WT animals and analyzed directly (crude extract) or following affinity purification on CR8-agarose beads. SDS-PAGE was followed by WB with antibodies directed against CDK2 and p21cip1. The nonpolycystic nephronophthisis model, used as a control, displayed no change in CDK2 expression but an increase in p21cip1. Thin horizontal lines on the left of the CDK2 and p21cip1 blots indicate the position of the 39- and 21-kDa MWM, respectively. Thin lines on the right of the blots indicate the positions of CDK2 and p21cip1, respectively.

