Fig. 8.
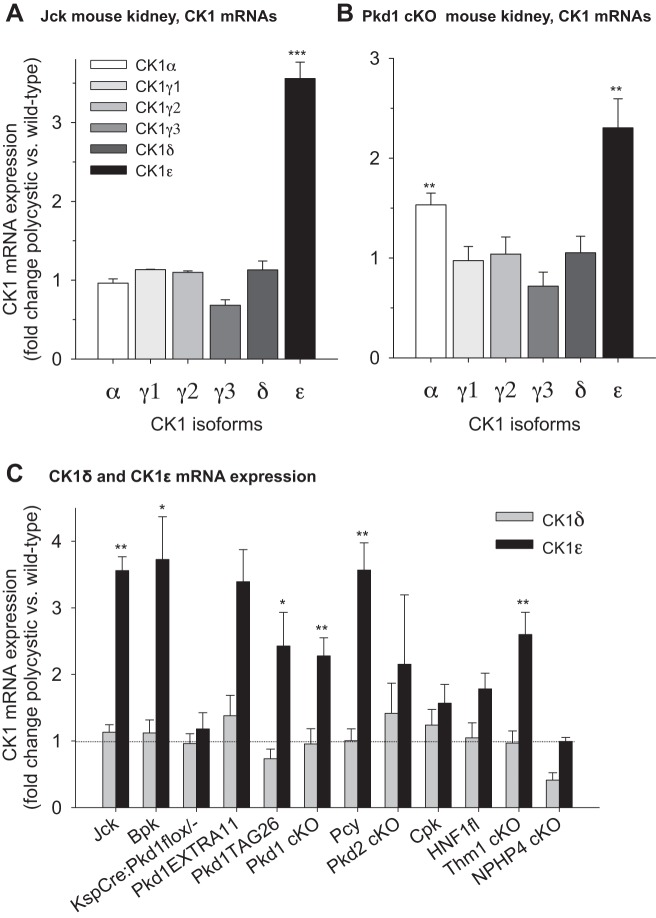
CK1ε mRNA expression is increased in representative PKD models. A: mRNA expression levels of all CK1 isoforms in kidneys of jck and wild-type (WT) mice were quantified by PCR. The values were normalized on the basis of TATA-binding protein (TBP) mRNA levels and are expressed as fold change in polycystic over WT kidney levels. B: expression levels of all CK1 isoforms in Pkd1-cKO and control mouse kidneys. C: expression levels of CK1ε and CK1δ isoforms in the kidneys of various PKD models, normalized with TBP mRNA levels and presented as fold change of polycystic over healthy kidneys levels. Horizontal dotted line indicates identical level of expression for healthy and polycystic kidneys. Number of different kidneys (WT/PKD): 2/3 (Jck), 3/3 (Bpk), 2/2 (KspCre), 4/4 (Tag26), 2/2 (Extra 11), 4/4 (Pkd1cKO), 3/3 (Pcy3), 2/2 (Pkd2cKO), 4/4 (Cpk), 4/4 (Hnf1β), 5/4 (Thm1cKO), and 3/3 (Nphp4). Tested in triplicate. *P = 0.01–0.05, **P = 0.001–0.01, and ***P < 0.001 (Student’s t-test).

