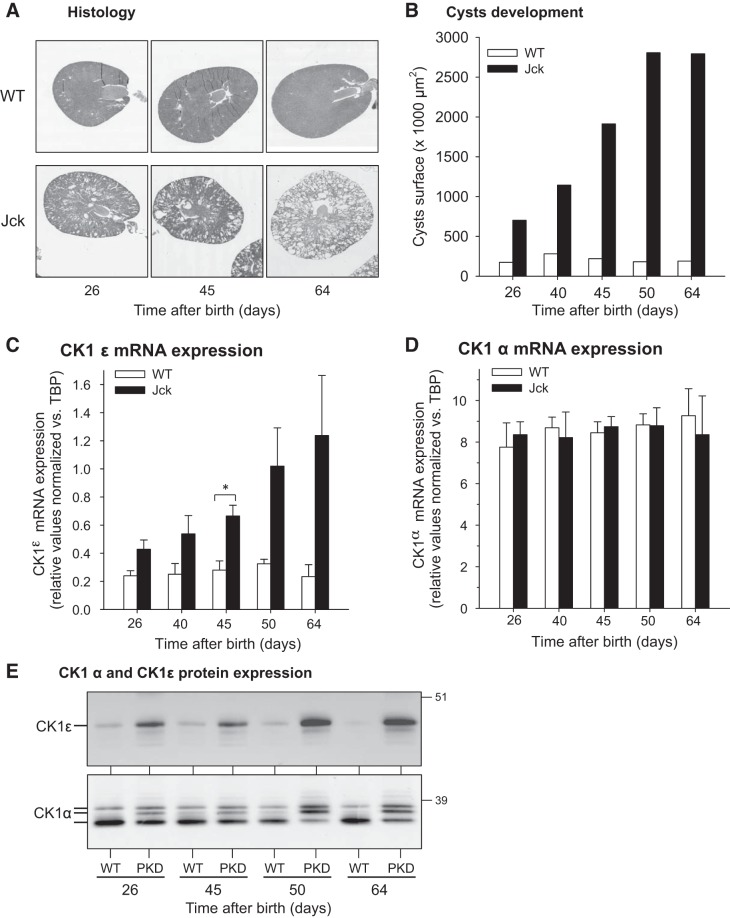
Fig. 10.
CK1ε and CK1α expression is altered with PKD progression in jck mice. A: histology of jck and WT kidneys at different times after birth. B: quantification of cyst development in jck mice. C and D: CK1ε (C) and CK1α (D) mRNA expression levels in jck and WT mice kidneys (normalized to TBP levels) at different time points. Number of different kidneys (WT/PKD): n = 2 for each time point. Tested in triplicate. E: CK1ε and CK1α protein expression in jck and WT mice kidneys at different time points. Kidney extracts were loaded on CR8-agarose beads, bound proteins were resolved by SDS-PAGE, and CK1 isoforms were detected by WB with specific antibodies. *P = 0.01–0.05 (Student’s t-test).

