Fig. 3.
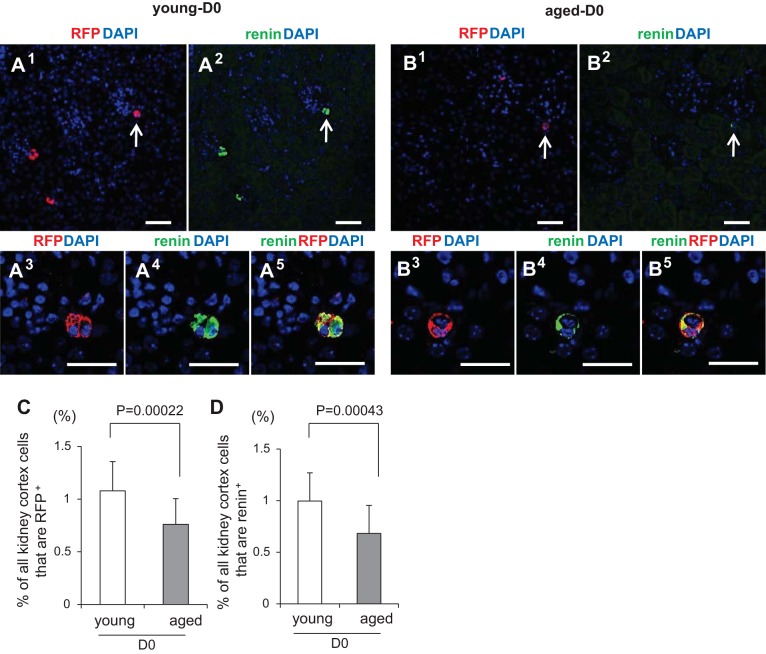
Red fluorescent protein+ (RFP+) and renin+ cells at D0. Representative images of double staining for RFP (red), renin (green), merged channels (yellow), as well as DAPI staining (blue) was performed in young (A) and aged (B) mice. Arrows in the lower magnification images (A, 1–2, B, 1–2) indicate the juxtaglomerular (JG) location in the high-magnification images (A, 3–5, B, 3–5). Scale bars represent 50 μm. C: graph of the percentage of RFP+ cells in young (n = 21, open bar) and aged (n = 23, solid bar) mice at D0. D: graph of the percentage of renin+ cells in young (n = 21, open bar) and aged (n = 23, solid bar) mice at D0.

