
Fig. 2.
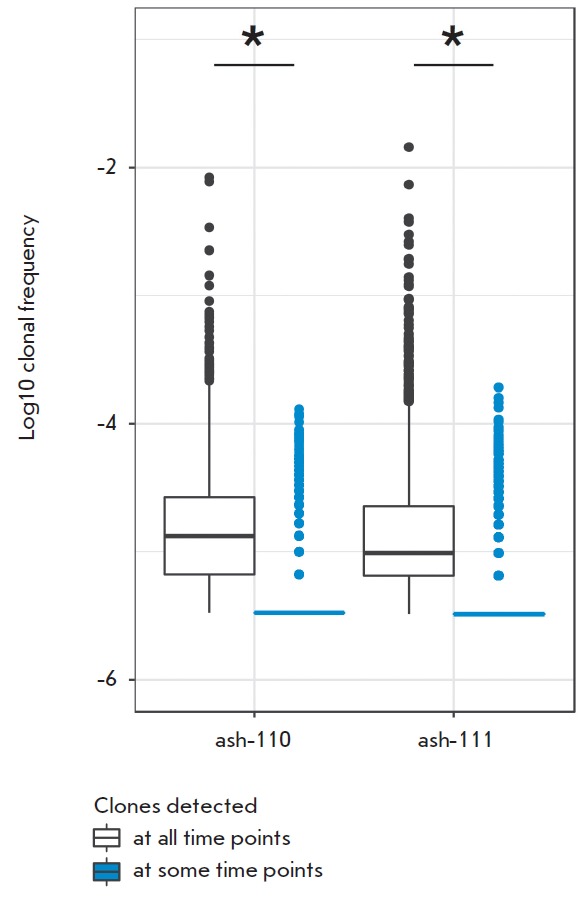
Clonal frequency distribution in the initial repertoire according to the detection of clonotypes in samples after HSCT. White box plots show the frequency distribution of clonotypes found in all the analyzed samples, including the time point before HSCT; blue box plots show the frequency distribution of clonotypes present at point 0 but not found in at least one sample after HSCT (points 4, 12 or 24). *The p-value < 2.2×10⁻¹⁶ (Mann–Whitney U-test).