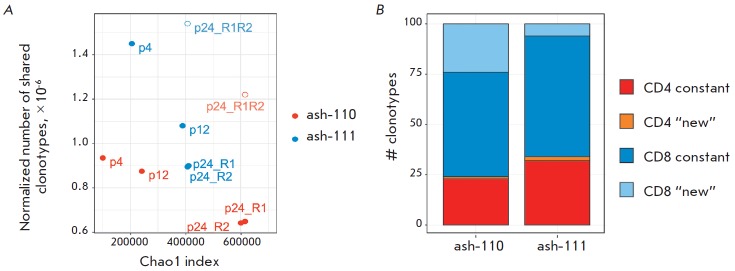
Fig. 5.
Degree of clonal repertoire renewal after HSCT. (A) Correlation between the normalized number of the clonotypes shared between point 0 and points 4 (p4), 12 (p12), 24 (in two replicas: p24_R1 and p24_R2) and the diversity of a reference sample. Points p24_R1R2 represent the comparison of replicas of point 24. (B) Composition of the 100 most abundant clonotypes in the repertoire of point 24. CD8+ cytotoxic clonotypes are shown in blue and light blue; CD4+ T-helper clonotypes are shown in red and orange.

