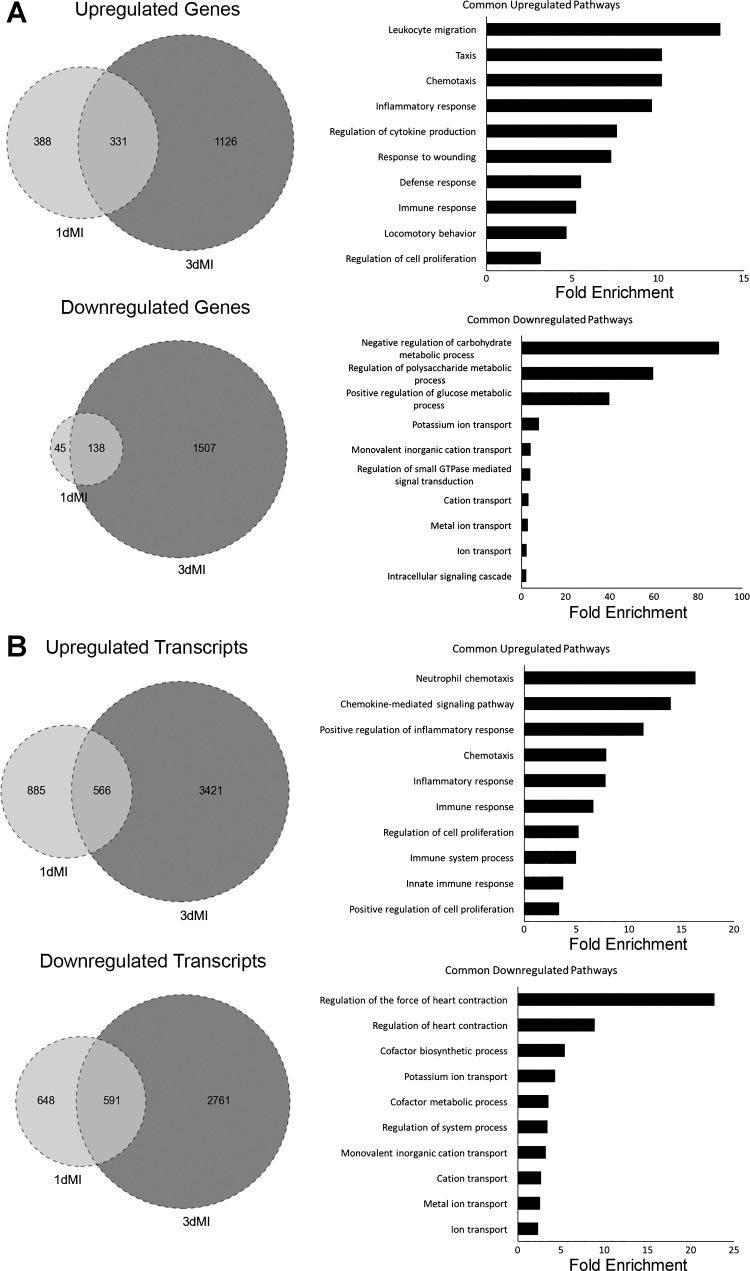
Fig. 3.
Comparison of differentially expressed genes and transcripts at 1 day and 3 days post-MI. A: analysis of differentially expressed genes. All genes included in analysis had fold change values of log2 ≥2 (or ≤−2). Venn diagrams show number of genes commonly up- and downregulated at both 1 and 3 days post-MI. Genes common to both time points were then analyzed by DAVID to find commonly dysregulated pathways by gene ontology (GO) terms. Bar graphs show top 10 GO terms as ranked by P value (or EASE score, determined by modified exact Fisher’s test) as well as fold enrichment for each term. All P < 0.05. B: analysis of differentially expressed transcripts. All parameters for Venn diagrams and DAVID analysis are the same as described for A.

