Fig. 6.
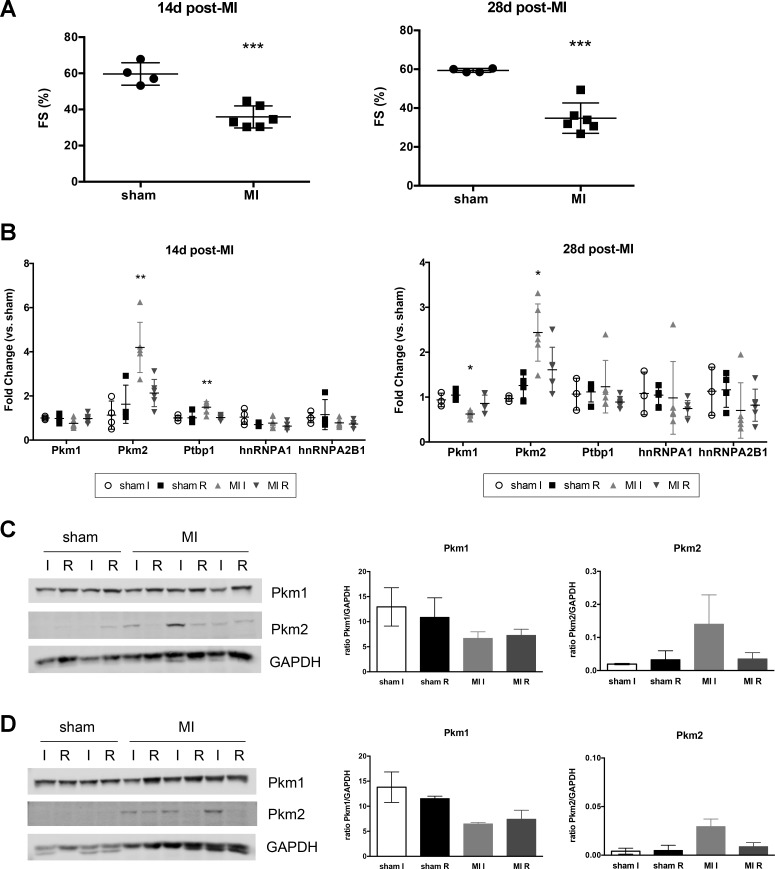
Functional analysis and Pkm expression at 14 and 28 days post-MI. A: fractional shortening (FS) in sham and MI mice at baseline at 14 and 28 days post-MI. Student’s t-test vs. sham mice. ***P = 0.0003 for both 14 and 28 days after MI. B: semiquantitative PCR analysis of Pkm transcripts and associated splicing factors. Data shown with means ± SD. One-way ANOVA with Tukey’s multiple comparisons. *P < 0.05, **P < 0.01. Statistical significance for MI I compared with all other groups. Western blotting for Pkm1 and Pkm2 at 14 days (C) and 28 days (D) after MI. Right: quantification of expression. GAPDH used as loading control and normalization.

