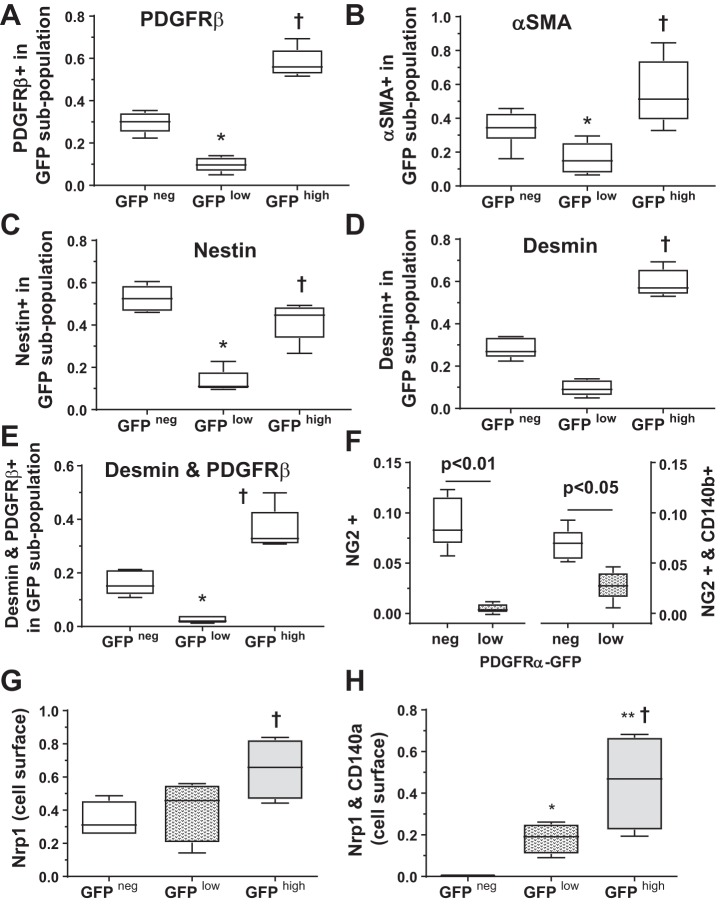
Fig. 1.
Flow cytometry [fluorescence-activated cell sorting (FACS)] demonstrated that platelet-derived growth factor (PDGF)-α receptor (PDGFRα)-expressing parenchymal cells contain neuropilin-1 (NRP1), PDGFRβ, desmin (DES), and nestin (NES). Parenchymal mesenchymal cells were isolated at postnatal day 8 from 5 mice, all from different litters, fixed, permeabilized, and stained for PDGFRβ, ACTA2 [α-smooth muscle actin (α-SMA)], NES, DES, and CD45 (a negative selection marker that excluded fibrocytes and macrophages). Cells were gated based on their level of GFP intensity, yielding 3 subpopulations: GFPneg (non-GFP-expressing) and GFPlow and GFPhigh, which had lower and higher levels of eGFP, respectively. A–E: proportion of each subpopulation that contains PDGFRβ [CD140b (A)], α-SMA [ACTA2 (B)], NES (C), DES (D), and DES and PDGFRβ (E). F: in a different cohort of 5 PDGFRα-GFP mice from 3 different litters, isolated mesenchymal cells were stained for neural/glial antigen-2 [NG2 (CSPG4)] and CD140b and analyzed by FACS. G and H: in a 3rd cohort of 4 mice from different litters, mesenchymal cells were isolated, fixed but not permeabilized, and analyzed by FACS to assess the abundance of cells with NRP1 and PDGFRα (CD140a) on the cell surface. Box-and-whisker (Tukey) plots show data from 5 (A–E) and 4 (F–H) separate cell isolations. *P < 0.05, GFPlow vs. GFPneg; †P < 0.05, GFP high vs. GFPneg; **P < 0.05, GFPhigh vs. GFPlow (by 2-way ANOVA).

