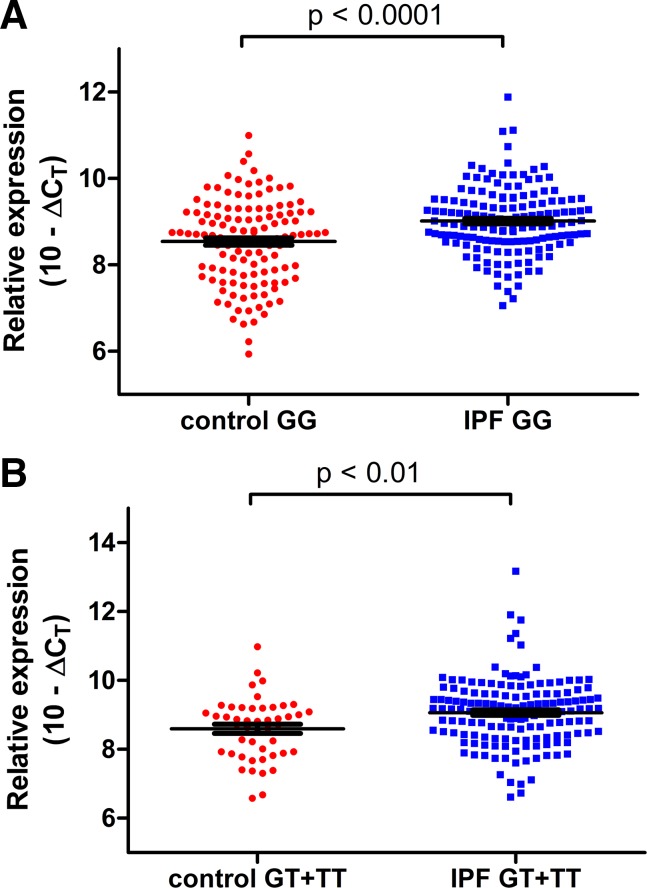
Fig. 2.
The relationship of the complement component 3 (C3) expression based on the MUC5B promoter rs35705950 genotypes in the control and idiopathic pulmonary fibrosis (IPF) lung tissues by quantitative PCR. A: IPF lung tissue with GG had significantly higher C3 expression than control lung with GG. B: IPF lung tissue with T allele had significantly higher C3 expression than control lung with T allele. Statistical tests were performed on Δcycle threshold (ΔCT) values (C3 ΔCT values normalized to housekeeping gene GAPDH), and relative expression is visually depicted as (10 – ΔCT) on this graph. Lines indicate mean values with bars denoting ± SE.

