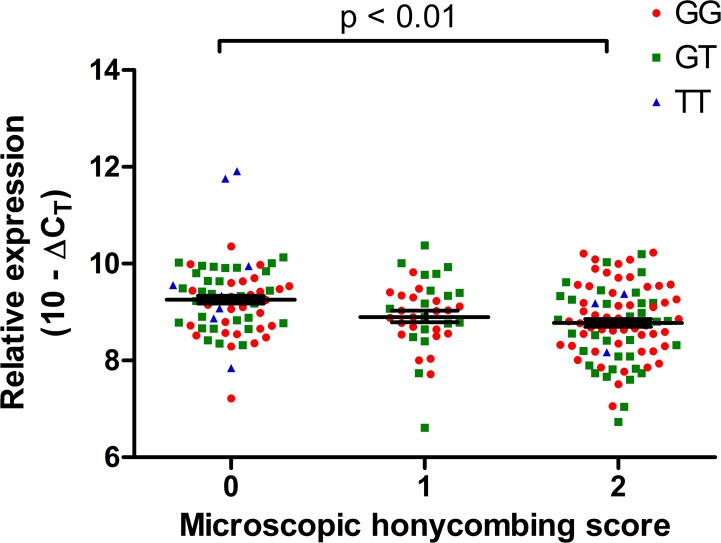
Fig. 3.
The comparison of complement component 3 (C3) expression related to microscopic honeycombing scores. Regarding microscopic honeycombing scores, 0, absent; 1, rare; 2, present. The C3 expression was significantly higher for 0 than 1 or 2 score. Statistical tests wwere performed on Δcycle threshold (ΔCT) values (C3 Ct values normalized to housekeeping gene GAPDH), and relative expression is visually depicted as (10 – ΔCT) on this graph. The data of GG, GT, and TT subjects are plotted in red, green, and blue colors, respectively. Lines indicate mean values with bars denoting ± SE.

