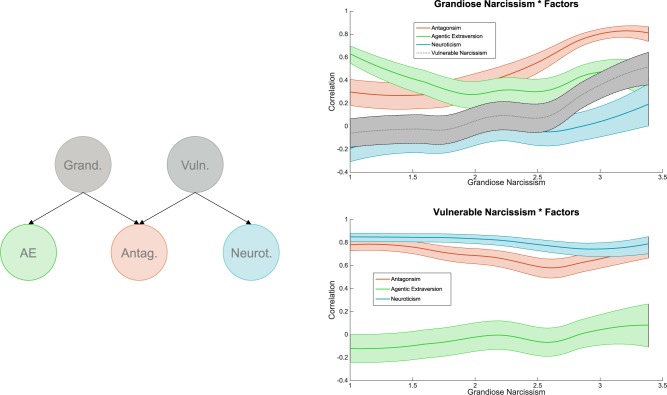
FIGURE 2.
Left: Schematic illustration of the trifurcated model of narcissism (adapted from Miller et al., 2016). AE, agentic extraversion. Right: Visualization of the correlation between grandiose (top panel) and vulnerable (bottom panel) narcissism and the factors of the trifurcated model as a function of grandiose narcissism. Plots display the correlation (including 95% CI band) in windows of n = 250 data points, iteratively computed for every X-value (starting from the lowest) and smoothed using a loess filter. The upper tail uses a minimum of n = 100 data points as ceiling.

