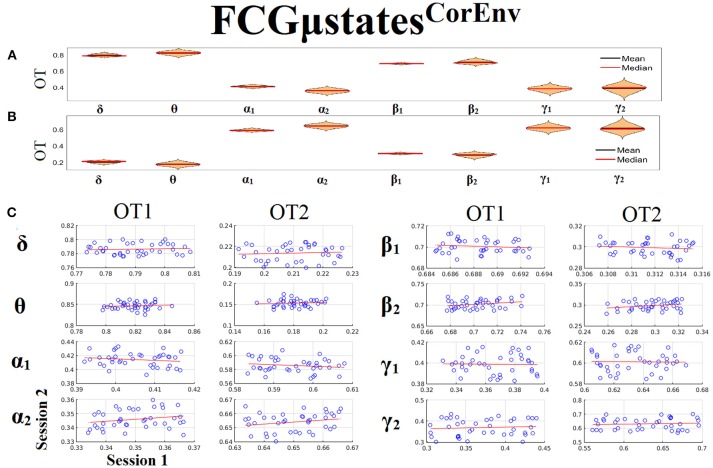
Figure 13.
Reliability of Occupancy Time (OT) based on on FCGμstatesCorEnv across frequency bands. (A) Mean and median values of OT across subjects and scan sessions for FCμstates1 and for each frequency band. (B) Mean and median values of OT across subjects and scan sessions for FCμstates2 and for each frequency band. (C) Scatter-plot of subject-specific OT for both sessions with the corresponding fitted line for each frequency band. All the correlations were weak and non-significant (p > 0.4). Each blue circle corresponds to a participant.

