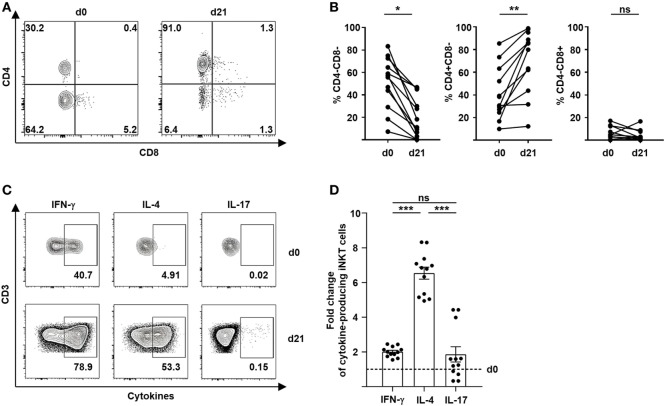
Figure 2.
Preferential expansion of Th2-biased CD4+ invariant natural killer T (iNKT) cells. (A) Representative dot plots showing iNKT-cell subsets defined by the expression of CD4 and CD8 before and 21 days after cell culture. All events are gated on live iNKT cells. (B) Relative change of CD4−CD8− iNKT cells (n = 12), CD4+CD8− iNKT cells (n = 11), and CD4−CD8+ iNKT cells (n = 11) over 21 days of cell culture. (C) Representative dot plots showing Th1, Th2, and Th17 cytokine production of iNKT cells before and 21 days after cell culture. All events are gated on live iNKT cells. (D) Fold change of cytokine-producing iNKT cells at day 21 of cell culture compared to day 0 (dashed line) is shown for IFN-γ, IL-4, and IL-17 (n = 12). Error bars indicate SEM, *p < 0.05, **p < 0.01, ***p < 0.001.

