Figure 4.
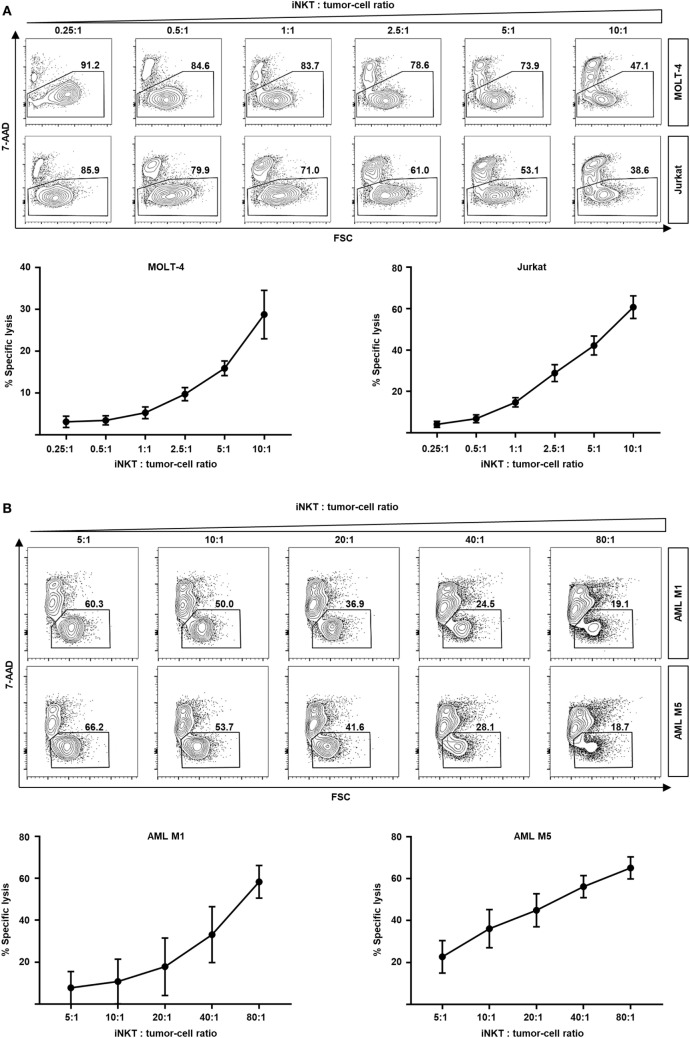
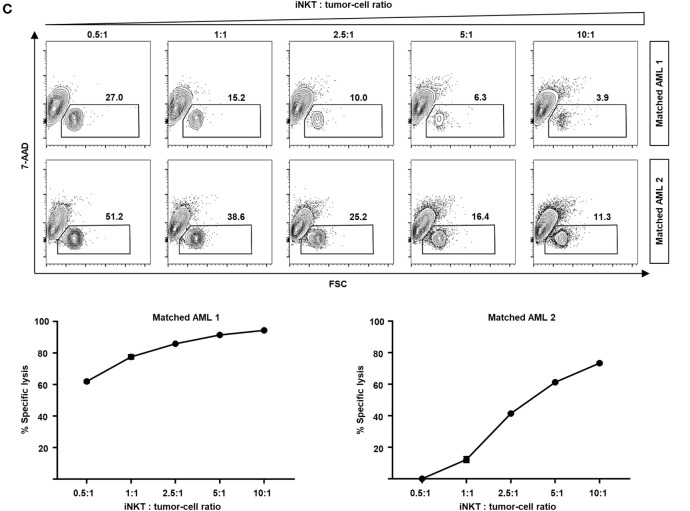
Dose-dependent kill of leukemia cell lines and patient leukemia cells by culture-expanded human invariant natural killer T (iNKT) cells. (A) Representative dot plots and specific lysis of MOLT-4 (92% 7-AAD- without iNKT cells) and Jurkat leukemia cells (87% 7-AAD- without iNKT cells) after co-incubation with culture-expanded iNKT cells. Each graph shows pooled data from four independent experiments with different culture-expanded iNKT cells. (B) Representative dot plots and specific lysis of AML M1 (88% 7-AAD- without iNKT cells) and AML M5 patient leukemia cells (89% 7-AAD- without iNKT cells) after co-incubation with culture-expanded HLA-mismatched iNKT cells. Each graph shows pooled data from four independent experiments with different culture-expanded iNKT cells tested against different patient AML cells. (C) Representative dot plots and specific lysis of patient leukemia cells (74 and 51% 7-AAD- without iNKT cells, respectively) after co-incubation with culture-expanded HLA-matched donor iNKT cells. Shown are two representative examples from three independent experiments. All events are gated on PBS57-loaded CD1d tetramer phycoerythrin negative cells to exclude iNKT cells. Error bars indicate SEM.


