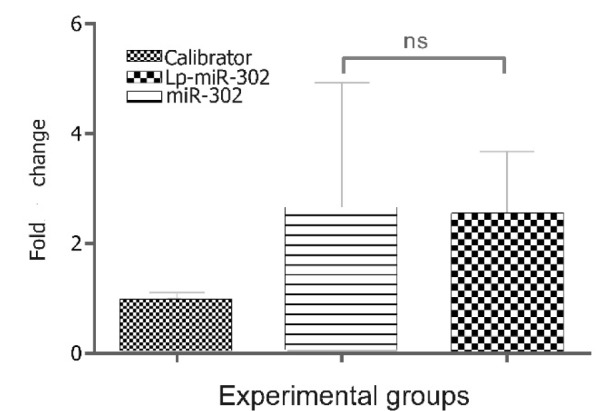
Figure 5. The relative expression of parp1 after miR-302a transfection with and without liposome. The Parp1 levels were transformed into quantities using the formula 2-ΔΔCt. Despite increased level of Parp1 expression, no significant (ns) difference was observed between free miR-302 and LP-miR-302. Error bars represent standard deviation.