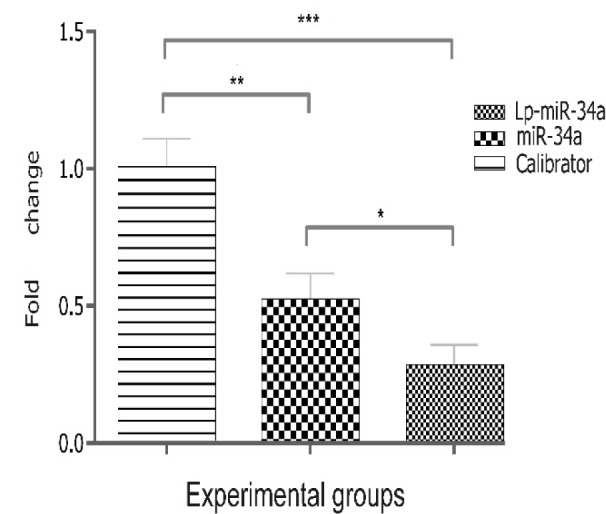
Figure 6. The relative expression of Parp1 after miR-34a transfection with and without liposome. The Parp1 levels were transformed into quantities using the formula 2-ΔΔCt. Error bars represent standard deviation. *P value < 0.05; **P value < 0.0017; ***P value < 0.0002.

