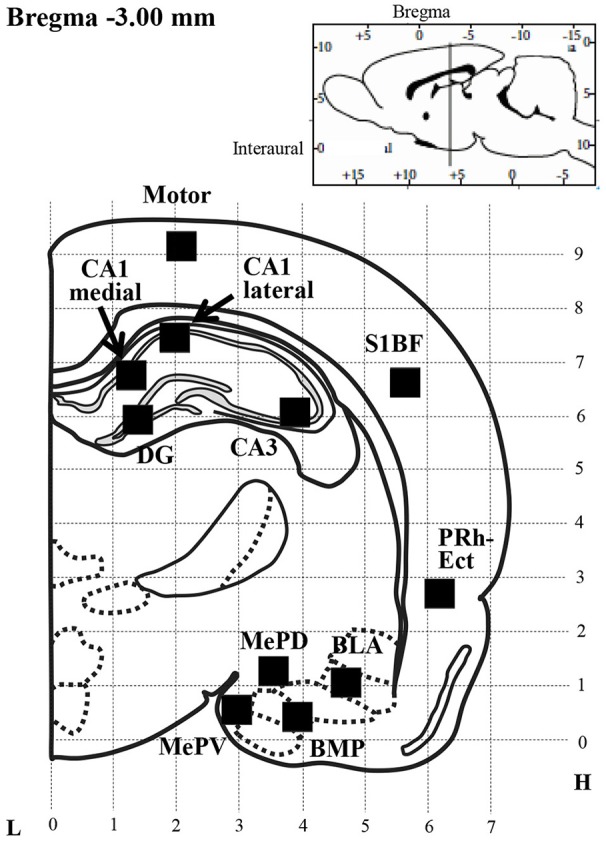
Figure 1.

Schematic illustration of a brain section selected for quantitative analysis of immunoreactivity (IR) of Kir4.1 or GFAP. Filled squares in each brain region indicate the areas analyzed for counting of Kir4.1-IR- or GFAP-IR-positive cells, which were set according to the rat brain atlas (Paxinos and Watson, 2007). Motor, motor cortex; S1BF, primary somatosensory cortex barrel field; PRh-Ect, perirhinal-ectorhinal cortex; MePV, medial amygdaloid nucleus posteroventral part; MePD, medial amygdaloid nucleus posterodorsal part; BLA, basolateral amygdaloid nucleus anterior part; BMP, basomedial amygdaloid nucleus posterior part; CA1 medial or lateral, CA3 and DG, hippocampal CA1 medial, CA1 lateral, CA3 and dentate gyrus; L, Lateral coordinates (mm); H, Horizontal coordinates from interaural line (mm).
