
Figure 10.
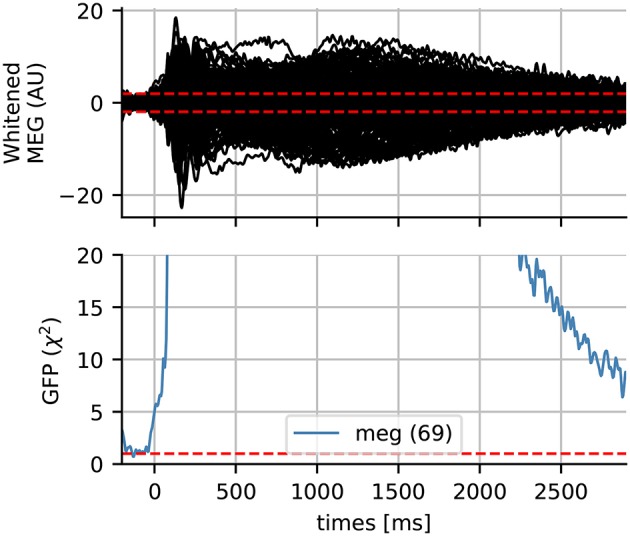
Whitened MEG data for subject 4 and the global field power (GFP) which follows a χ2 distribution if the data is assumed Gaussian. The dotted horizontal red lines represent the expected GFP during the baseline for Gaussian data. Here the data slowly return to baseline at the end of the epoch.