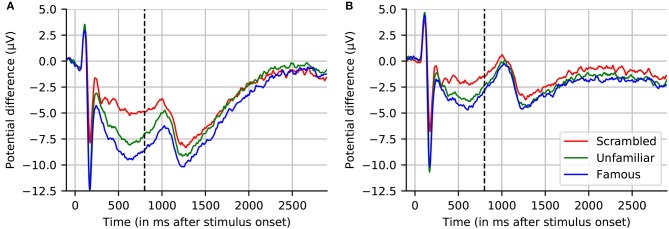
Figure 5.
Grand averaged evoked response across 16 subjects for channel EEG065. (A) No highpass filter. (B) Highpass filtered at 1.0 Hz. Note that, similar to (A), the results reported by Wakeman and Henson (2015) (dashed line at 800 ms indicates where their plot stopped) show large drifts, but these return to near-baseline levels toward the end of a sufficiently long interval (here, 2.9 s) even without applying a highpass filter.

