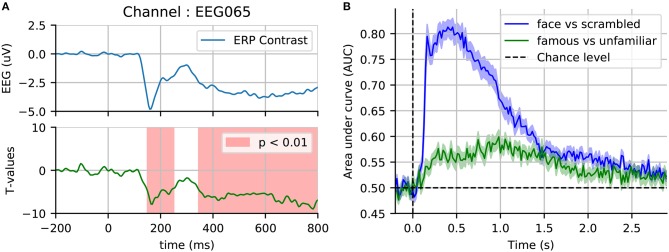
Figure 6.
Sensor space statistics. (A) A single sensor (EEG065) with temporal clustering statistics. The clustering is based on selecting consecutive time samples that have exceeded the initial paired t-test threshold (0.001), and finding clusters that exceed the mass expected by chance according to exchangability under the null hypothesis (p < 0.01, shaded areas). (B) Cross-validation score of time-by-time decoding. As opposed to a cluster statistic, time decoding is a multivariate method which pools together the signal from different sensors to find discriminative time points between two conditions.

