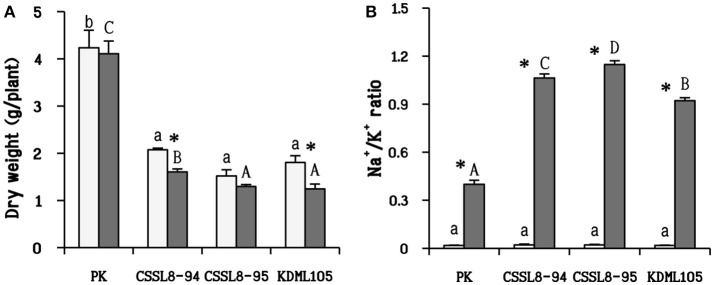
Figure 1.
Dry weight (A) and Na+/K+ ratio (B) of non-stressed-plants (light bars) and 9 days after salt application (gray bars). The values show means ± SD. For the light bars and gray bars, different lower case and capital letters indicate that the means are significantly different (P ≤ 0.05). The significant difference (P ≤ 0.05) of values between control and stressed plants is indicated by asterisk (*).

