Figure 2.

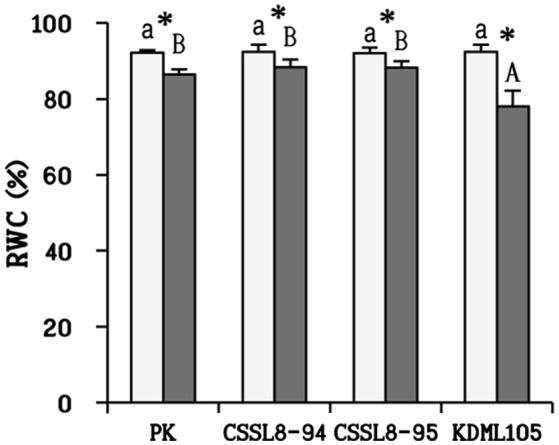
Relative water content (RWC) in plants at normal conditions (light bars) and 9 days after salt stress (gray bars). The values show means ± SD. For details of statistical symbols, see Figure 1.

Relative water content (RWC) in plants at normal conditions (light bars) and 9 days after salt stress (gray bars). The values show means ± SD. For details of statistical symbols, see Figure 1.