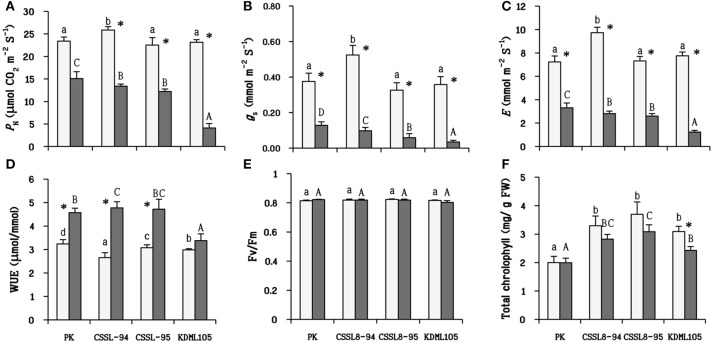
Figure 3.
Photosynthetic parameters in plants net photosynthesis rate (A) stomatal conductance (B) transpiration rate (C) water use efficiency (D) the maximum quantum yield of PSII (E) and total chlorophyll (F) at normal conditions (light bars) and 9 days after salt stress (gray bars). The values show means ± SD. For details of statistical symbols, see Figure 1.

