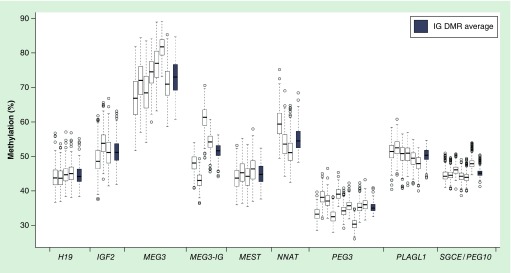
Figure 1. . Distribution of average and CpG specific imprinted gene differentially methylated region percent methylation in Center for the Health Assessment of Mothers and Children of Salinas newborns.
The white box plots represent distributions of the % methylation of individual CpGs in the nine imprinted gene DMRs in 296 newborns. The leftmost box plot for each imprinted gene DMR represents the first CpG assessed in the DMR. The gray box plots to the right of each group of white boxes represent the average % methylation across all CpG sites within an IG DMR. The total number of observations for each imprinted gene varies slightly due to missing data.
DMR: Differentially methylated region.

